Among the new employment figures the Labor Department released Friday morning is an obscure one that’s ripe for politicking: the labor force participation rate. It measures the percentage of the population age 16 and above who are actually working. The labor force participation rate fell last month to 63.6 percent, its lowest level since 1981.
In the midst of an economic recovery — albeit a slow one — why would the labor participation rate continue to be hover near four-decade lows?
If you take a long view of the figures, something becomes abundantly clear: there’s a lot more behind the country’s slumping labor force participation rate than today’s weak economy. The real reasons behind the fluctuations in the rate over the past several decades are fascinating, and they raise some of the biggest questions in the field of labor economics.
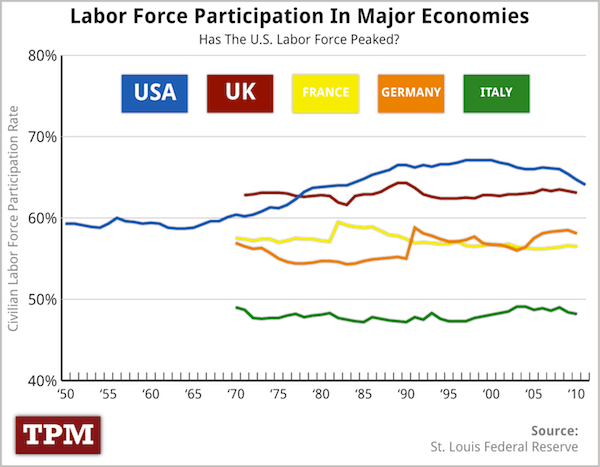
After climbing steadily for decades U.S. labor force participation plateaued about a decade ago, and began falling.
There’s no single, tidy explanation for what triggered the increase in the first place or why it’s come to an end, but the single clearest factor is that last century women began pouring into the work force — a phenomenon that came to an end in the last decade.

via Explaining A Troubling Figure In The Jobs Report | TPMDC.


Discussion
Trackbacks/Pingbacks
Pingback: America’s Silent Crisis – Single Working Mother « Job Market Monitor - July 18, 2012
Pingback: US / Nearly 6.9 million people out of the labor force want a job « Job Market Monitor - December 17, 2012
Pingback: US – Supply factors are driving down participation rate (demographics and increased incentives to drop out), not weak labor market demand write BofA | Job Market Monitor - May 19, 2014