![]() The extensive Job Gap as tremendous impact. According to the 2012 of the ILO report on Global Employment Trends(GET), the world facesa Global Job Gap of 600 million jobs.
The extensive Job Gap as tremendous impact. According to the 2012 of the ILO report on Global Employment Trends(GET), the world facesa Global Job Gap of 600 million jobs.
The Brookings’ Hamilton Project “updates America’s job gap, the number of jobs that the U.S. economy needs to create in order to return to pre-recession employment levels while absorbing the 125,000 people who enter the labor force each month” writes Michael Greenstone and Adam Looney in The Great Recession May Be Over, but American Families Are Working Harder than Ever on brookings.edu.
The June’s 2012 “job gap” was estimated at 12.3 million jobs.
All long will it takes for the US labor market to fully recover from the impact of the Great Recession, filling that Jobs Gap ?
Using best historical performances, Greenstone and Looney produce the chart below which “shows how the job gap has evolved since the start of the Great Recession in December 2007, and how long it will take to close under different assumptions for job growth. The solid line shows the net number of jobs lost since the Great Recession began. The broken lines track how long it will take to close the job gap under alternative assumptions about the rate of job creation going forward.”

“If the economy adds about 208,000 jobs per month, which was the average monthly rate for the best year of job creation in the 2000s, then it will take until October 2023—over 12 years—to close the job gap. Given a more optimistic rate of 321,000 jobs per month, which was the average monthly rate for the best year of job creation in the 1990s, the economy will reach pre-recession employment levels by September 2016—over five years.” conclude the authors.
Source & details @:

But the story goes on. This Job Gap contributes to the growing income inequalities writes Jared Bernstein, Senior Fellow, Center on Budget and Policy Priorities in Hufftington Post.
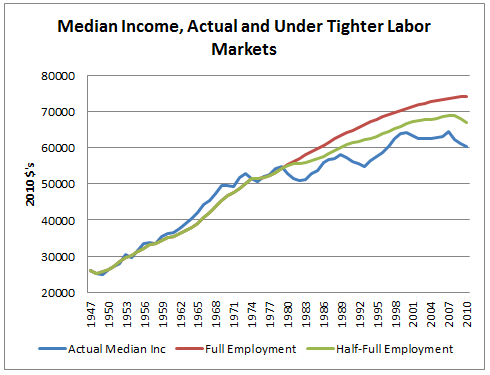
Bernstein: One of the more compelling graphs in the inequality debate is the growth of real family incomes for low, middle, and high income families, going all the way back to the 1940s. The reason for its popularity is that it’s one of the few pictures (though not the only one) that very clearly delineates a period of growing together and a period of growing apart.
For example, comparing two roughly 30 year periods, 1947-79, when inequality was relatively unchanged, incomes just about doubled for each group shown in the figure. But between 1979 and 2010, income growth at the middle and bottom was pretty much flat, with the important exception of the mid-1990s, discussed below. High incomes rose more consistently over the period, though that trend too looks flat in the 2000s. That is, however, an artifact of these data, which exclude realized capital gains, an important income source in reference to inequality’s growth over this period. In fact, other data which include capital gains show that the share of national income accruing to the top 1 percent grew to historic highs in 2007, before falling with the financial bust in 2008.
Now, there is of course a lot more than unequal growth delineating the two periods. The latter period saw many more women entering the workforce, demographic changes, including more single parent families, and importantly, at least until the mid-1990s, a significant slowing of productivity growth. But there’s no question that inequality was a major factor in play (see note #1).
Another big distinction between these two roughly 30 year periods was the tightness of the labor market. Over the first period, 1947-1979, the average unemployment rate was 5.1 percent; over the second period, 1979-2010, it was 6.3 percent (6.1 percent through 2007). That doesn’t sound like that big a difference in terms of labor market tightness, but it is. Let me explain.
One useful way to assess labor market tightness is to compare the unemployment rate to a construct called the non-accelerating inflationary rate of unemployment, or the NAIRU. The idea behind the NAIRU is that a) there’s a tradeoff between low unemployment and inflation, and b) there’s a rate of unemployment that’s consistent with stable inflation. The implication is that if unemployment falls below the NAIRU, inflation will keep accelerating.
Read More @ :

via Jared Bernstein: Full Employment: A Force Against Rising Inequality and Stagnant Incomes.


Discussion
Trackbacks/Pingbacks
Pingback: Georgia | Some of highest income taxes on the working poor « Global Job Gap, Local Skills Gap - April 17, 2012
Pingback: U.S. Unemployment | Gallup Provides A Mixed Picture « Global Job Gap, Local Skills Gap - April 17, 2012
Pingback: UK Job Gap summed up in one chart « Global Job Gap, Local Skills Gap - April 20, 2012
Pingback: ILO and World Bank report on government actions against the Great Recession « Global Job Gap, Local Skills Gap - April 20, 2012
Pingback: It’s the economy, not the taxe code, which generates inequalities « Global Job Gap, Local Skills Gap - April 24, 2012
Pingback: At The Root Of the Global Job Gap | Finance and economic growth delinked « Global Job Gap, Local Skills Gap - April 28, 2012
Pingback: US | Job Gap is 9 million « Job Market Monitor - November 9, 2012
Pingback: EU | Invest for a job-rich recovery in Europe says László Andor European Commissioner responsible for Employment « Job Market Monitor - November 9, 2012
Pingback: The American Job Gap « Job Market Monitor - November 15, 2012
Pingback: Jobs for America / A Rooseveltian Second Term Agenda « Job Market Monitor - November 16, 2012
Pingback: US / For each dollar of federal highway grants received by a state, that state’s GSP rises by at least two dollars « Job Market Monitor - November 27, 2012