This report provides data on the demographic characteristics of people close to, but not below, official poverty thresholds from 1966 to 2012. The “near-poor” are people with family income between 100 and 125 percent of the poverty thresholds, allowing for a full examination of the low-income population. The statistics come from the Current Population Survey’s Annual Social and Economic Supplement.
The report compares the near-poor to those living below the poverty level by characteristics including age, sex, race, family type, region, educational attainment, employment status and health insurance coverage. Since federal and state assistance programs are targeted to the low-income population — including those in near-poverty — the report also gives assistance program participation rates of the near-poor. Although the data presented in the report are primarily national-level, some state-level statistics are presented using three-year averages.
According to the report:
- About 14.7 million people, or 4.7 percent of the population, were near-poor in 2012.
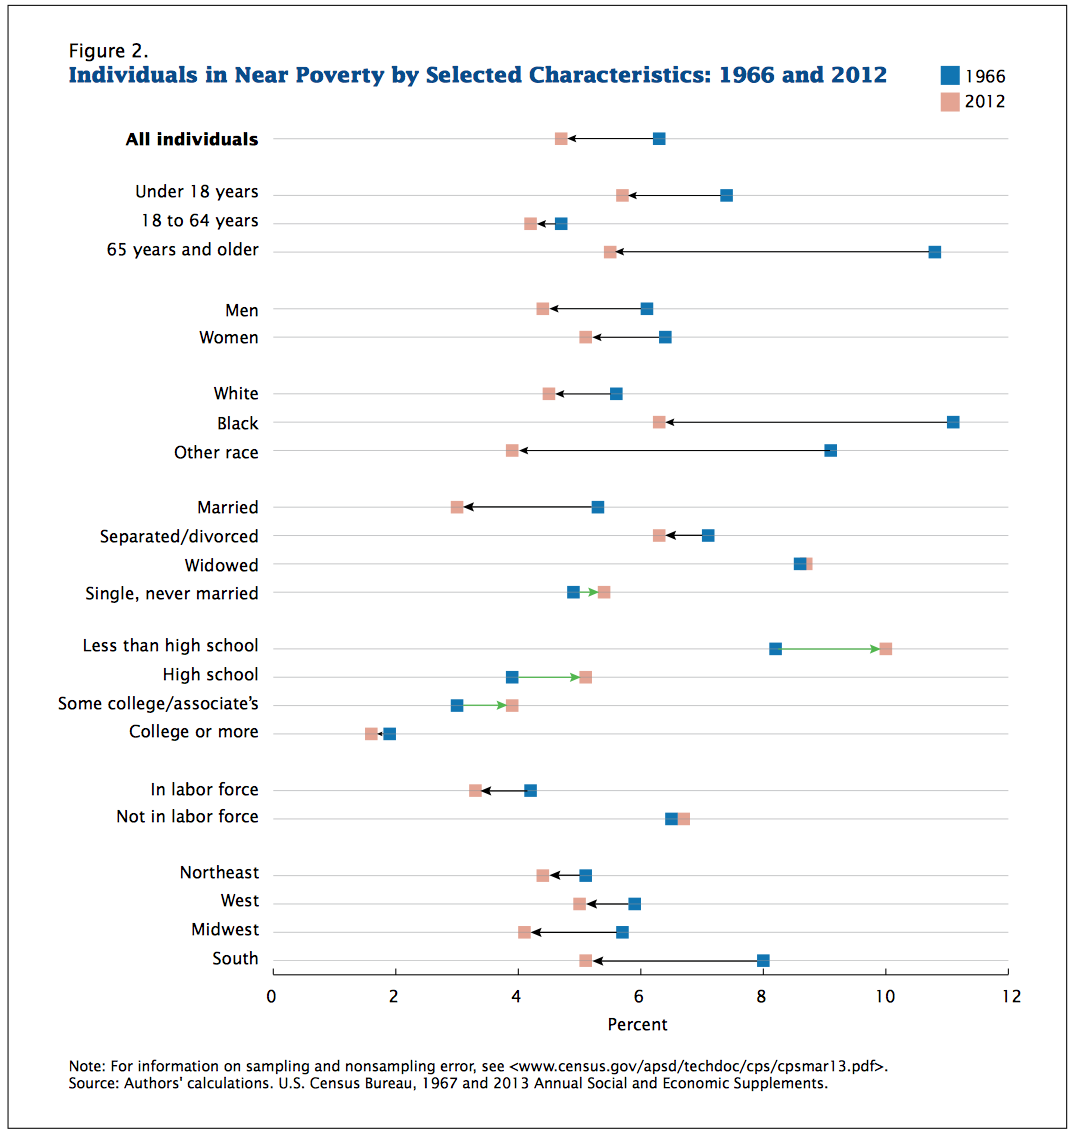
- The “near-poverty” rate is down from 6.3 percent in 1966; this rate has remained more stable than the poverty rate itself over the past four decades.
- The likelihood of being near-poor decreases as level of educational attainment rises.
- The near-poor were more likely than those below poverty to qualify for the Earned Income Tax Credit and less likely to be covered by public health insurance.
- Nearly one-third of the near-poor in 2012 received benefits from the Supplemental Nutrition Assistance Program, while 85 percent lived with a family member receiving a free or reduced lunch in school.
- Based on a 2010-2012 three-year average, 18 states had a near-poverty rate lower than the national average and 12 states higher.

Figure 2 shows the near-poverty rate for individuals by selected characteristics for 1966 (blue square) and 2012 (pink square). Arrows connect the squares to indicate the size and direction of the change. Black arrows represent a percentage point decrease from 1966 to 2012, while green arrows represent a percentage point increase from 1966 to 2012.
Chosen excerpts by Job Market Monitor. Read the whole story at Living in Near Poverty in the United States, 1966-2012 – Poverty – Newsroom – U.S. Census Bureau.
Related articles
- Low-Wage Workers and Poverty in US – Harder to Escape
- US / Women in Poverty
- US / Census Bureau / New poverty measure, higher than the official measure, at 16.1 percent
- US / Suburban poverty soars
- The 2011 Poverty Rate: What to Expect and How Long Will It Last? | Brookings Institution
- US / Those on Food Stamps Outnumber the Entire Population of Spain
- U.S. | Nearly $1 Trillion a year fighting poverty and over the next 10 years, governments will spend $250,000 for every poor American
- US / 4 in 5 adults face near-poverty, no work


Reblogged this on jkmhoffman.
Posted by jkmhoffman2014 | May 2, 2014, 8:29 am