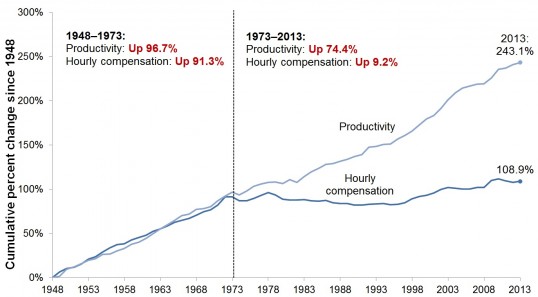
Since 1979, hourly pay for the vast majority of American workers has diverged from economy-wide productivity, as shown in Figure D, and this divergence is at the root of numerous American economic challenges. Between 1979 and 2013, productivity grew 64.9 percent, while hourly compensation of production and nonsupervisory workers, who comprise over 80 percent of the private-sector workforce, grew just 8.0 percent. Productivity thus grew eight times faster than typical worker compensation.
Chosen excerpts by Job Market Monitor. Read the whole story at Larry Top Charts for Wage Summit | Economic Policy Institute.


Thanks for sharing the information. I have to questions about the chart:
1. Does it have to do with the Cobb Douglas function where the share of wages and the share of profits were constante throughout time (at least until 70s)? Thanks in advance.
2. How the productivity of labour was estimated? GDP/Economically active population or it was estimated as a part of TFP?
Thanks in advance.
Posted by Alfonso Palomino | December 29, 2018, 7:24 amHi Alfonso,
Unfortunately, the original article seems to be no more available. So I can’t check for an answer there.
My understanding is that the chart is about the actual data. It is an observation and doesn’t derive from a theoretical production function.
Furthermore, the productivity here is simply real GDP / hours worked, so has to be compared with hourly wages.
This is the best that I can.
Thx for reading Job Market Monitor
Michel Cournoyer
Editor
Posted by Michel Cournoyer | December 29, 2018, 9:53 am