From 1981 to 2012, the overall unionization rate—defined as the proportion of all employees who are union members—declined. In this brief analysis, long-term trends in unionization rates are examined by gender, age group, province and industry using data from the Labour Force Survey and a collection of earlier data sources.
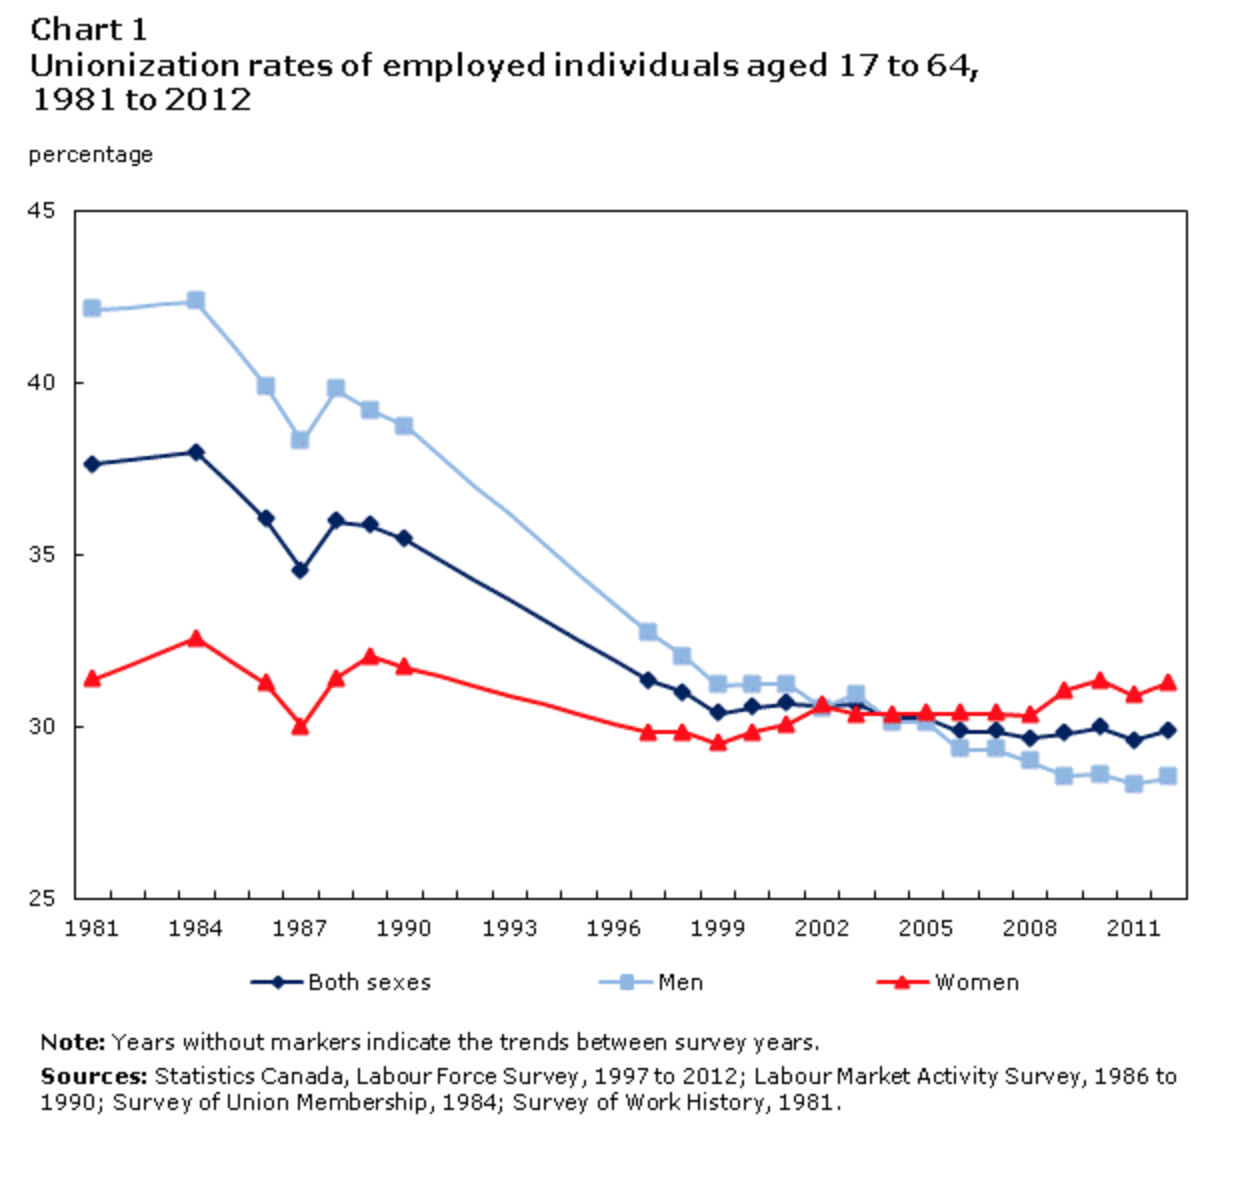
From 1981 to 2012, Canada’s unionization rate declined from 38% to 30%; most of the decline took place during the 1980s and 1990s.
The decline was observed among men, but not among women. The percentage of men in unionized jobs fell from 42% in 1981 to 29% in 2012; women’s unionization rate hovered around 30% during the same period.
However, the relative stability in women’s unionization rates masks two offsetting trends. The rate moderately declined among women younger than 45, but rose among those aged 45 to 64. Among men, unionization rates declined in all age groups.
Unionization rates declined in all provinces over the period. In 2012, Alberta had the lowest unionization rate, 22%; Newfoundland and Labrador, at 38%, and Quebec, at 37%, had the highest.
The overall unionization rate has changed little in recent years, although some changes have occurred within industries. For example, the rate has declined in some goods-producing industries, such as manufacturing.
Chosen excerpts by Job Market Monitor. Read the whole story at


Discussion
Trackbacks/Pingbacks
Pingback: US – How organized workers fueled america’s broadly shared prosperity | Job Market Monitor - April 13, 2014
Pingback: The World’s Worst Countries For Workers – A report | Job Market Monitor - May 28, 2014