The release of the 2012 American Community Survey (ACS) census data on poverty and income underscores the effects of a sluggish recovery that has played out unevenly across the nation’s major metropolitan economies and, even amid improving employment numbers, has left millions of Americans behind. Using ACS data on individuals living below the federal poverty level (e.g., $23,492 for a family of four in 2012), our analysis across and within the nation’s 100 largest metropolitan areas finds that:
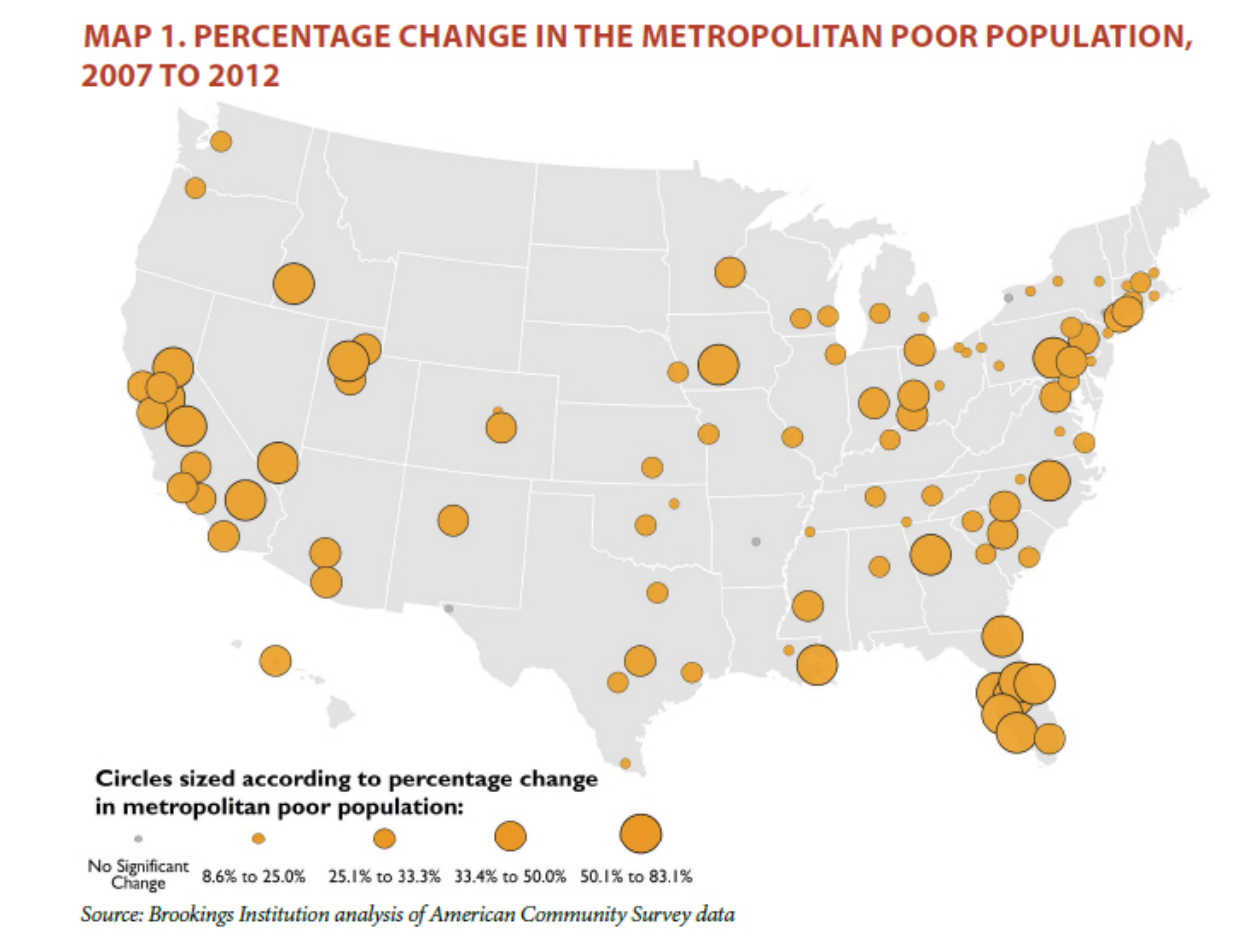
- For the fifth year in a row since the onset of the Great Recession, the number of poor residents in the nation’s 100 largest metro areas grew between 2011 and 2012, edging upward by 1.1 percent or 320,000 people. Though the smallest year over year change since the recession began, the increase in the metropolitan poor population diverged from the national trend, which remained flat from 2011 to 2012.
- The 2012 poverty rate for major metro areas stalled at 15.1 percent, matching the post-recession high in 2011. Most large metro areas (84) saw their poverty rates stuck at 2011 levels.
- By 2012, poor populations in 96 of the 100 largest metro areas remained above levels recorded before recession struck.
- Between 2011 and 2012, some cities began to show signs of recovery, but no major metro area registered significant progress against suburban poverty.
- Manufacturing-oriented metro areas in the Midwest and Northeast continued to rank highest for urban poverty rates in 2012, while metro areas in the West and South posted the highest suburban poverty rates.
Chosen excerpts by Job Market Monitor. Read the whole story at
![]()
via New Census Data Underscore Metro Poverty’s Persistence in 2012 | Brookings Institution.


Discussion
No comments yet.