Summary
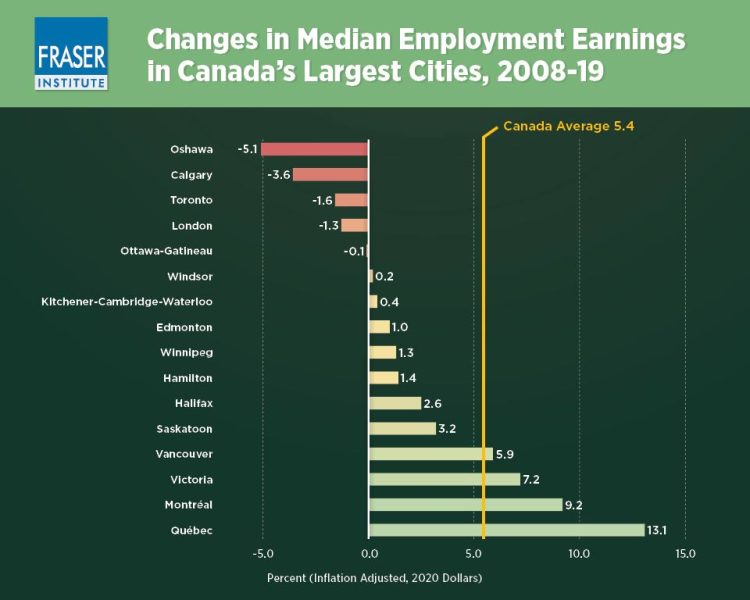
- This bulletin compares Canada’s 41 Census Metropolitan Areas (CMAS) in terms of growth in median employment income from 2008-2019.
- From 2008-19, median employment income growth across the 41 CMAs averaged 5.4 per cent.
- Many of the worst growth performers for this indicator were found in Ontario. Of the 6 CMAs that saw a decline in median employment income, 5 are in Ontario. The 6th is Calgary.
- An examination of the time-series shows that Ontario’s poor results are due to a severe shock during the 2008/09 recession and then a tepid recovery in subsequent years.
- The performance of the CMAs in resource-intensive regions and particularly those with large oil and gas industries is sensitive to the base year chosen.
- For example, over the 2008-19 period, median employment income growth in Alberta and Saskatchewan’s CMAs are clustered towards the bottom of the pack, but the growth rate was still above zero. An analysis focused on a more recent period, starting at the time of the 2015 decline in oil prices, for instance, would show much worse results in those CMAs.


Discussion
No comments yet.