The employment rate for those aged from 16 to 64 for February to April 2013 was 71.5%, down 0.1 percentage points from November 2012 to January 2013. There were 29.76 million people in employment aged 16 and over, up 24,000 from November 2012 to January 2013. 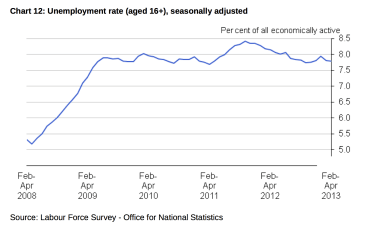
The unemployment rate for February to April 2013 was 7.8% of the economically active population, unchanged from November 2012 to January 2013. There were 2.51 million unemployed people, down 5,000 from November 2012 to January 2013.
The inactivity rate for those aged from 16 to 64 for February to April 2013 was 22.4%, up 0.1 percentage points from November 2012 to January 2013. There were 8.99 million economically inactive people aged from 16 to 64, up 40,000 from November 2012 to January 2013.
Between February to April 2012 and February to April 2013 total pay rose by 1.3% and regular pay rose by 0.9%.
Looking at employment by age group, as shown in Chart 1, for February to April 2013: 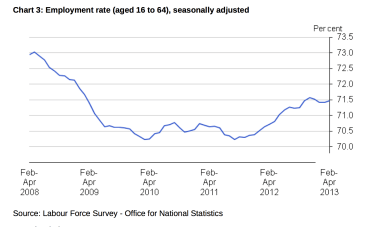
- The 16 to 24 age group had the lowest employment rate at 50.9 per cent (42% of all people in this age group were in full-time education).
- The 35 to 49 age group had the highest employment rate at 81.9%.
- For those aged 65 and over, the employment rate was 9.5%. The number of people aged 65 andover in employment has reached 1 million for the first time, partly through more people staying on in work and also more people of this age group in the population. Both the number of people in work and the employment rate for those aged 65 and over are the highest since comparable records began in 1992.
Chosen excerpts by Job Market Monitor


Discussion
No comments yet.